🔬 RamanBench Leaderboard — v0.1 (archived)
This is the archived v0.1 leaderboard (28 models, 74 datasets, 163 targets, AutoGluon 1.5 with fixed configurations). The current leaderboard is RamanBench v1: → go to the current leaderboard.
RamanBench benchmarks machine learning on Raman spectra: 74 public datasets (163 prediction targets), four application domains (Material Science, Biological, Medical, Chemical), classification and regression, data from many different instruments. The 28 models run from PLS, the long-standing spectroscopy default, through gradient boosting and deep networks to tabular foundation models (TabPFN, TabICLv2) and time-series classifiers (ROCKET, Arsenal).
Elo is calibrated so Random Forest = 1000.
Score is a combined normalized performance index based on F1 (classification) and RMSE (regression) — best model per target = 1, median = 0; higher is better.
Improvability % is the mean relative gap to the best model per target (lower is better).
v0.1.1
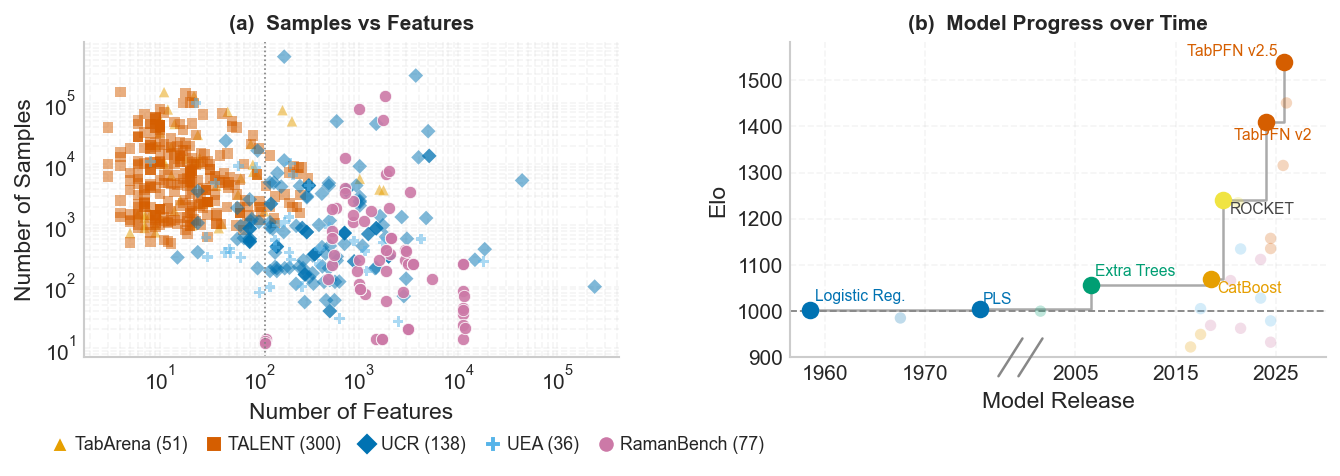
Left: RamanBench datasets (pink) occupy a high-dimensional, low-sample regime distinct from tabular benchmarks (TabArena, TALENT) and time-series benchmarks (UCR, UEA). Right: Model performance (Elo) vs. release year. PLS, the long-standing domain standard, held its leading position for decades; only in the last decade have modern methods begun to clearly surpass it. The state-of-the-art frontier is still advancing — no single model dominates across all tasks and domains.
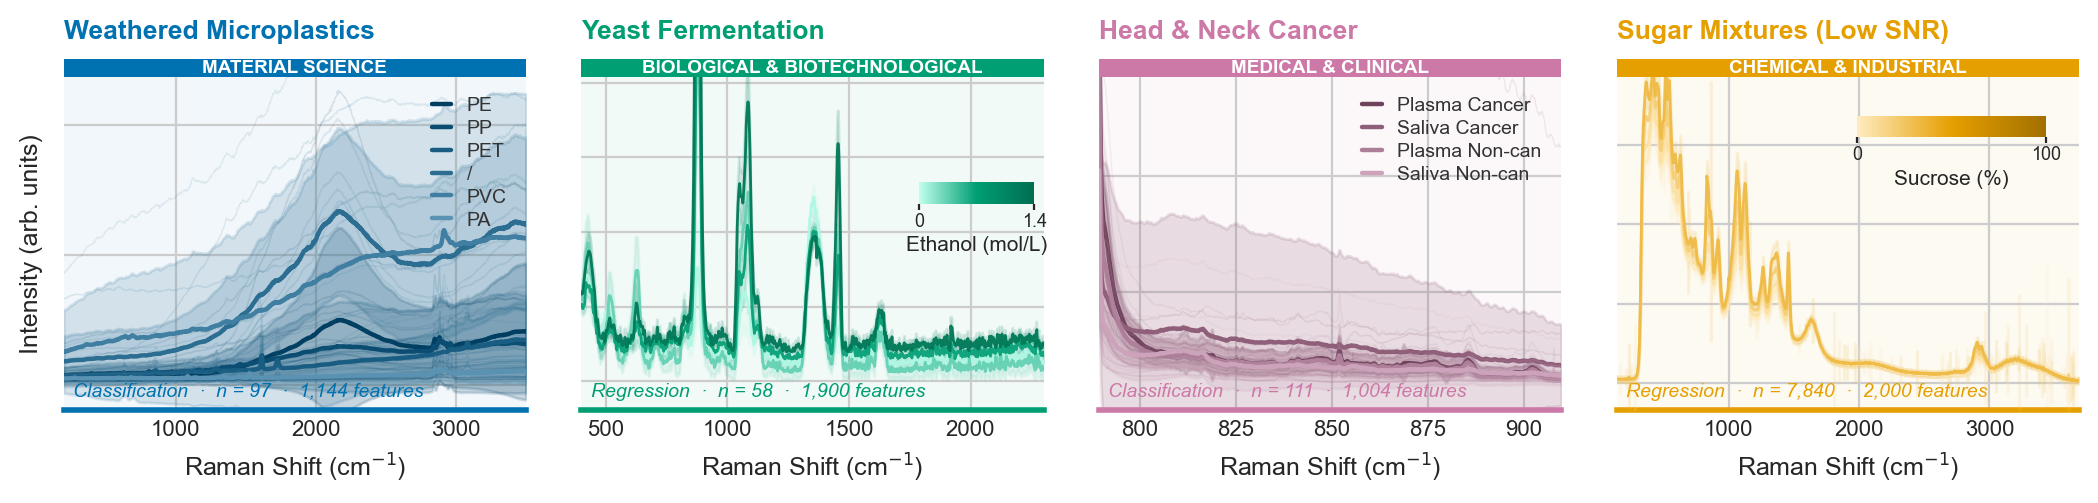
Representative Raman spectra from the four application domains in RamanBench. Each panel shows spectra from one domain, colored by class (classification) or by the target analyte value (regression, gradient from low to high). The thick line is the mean spectrum; shaded bands show ±1 standard deviation. Spectral ranges, sample sizes, noise levels, and analytical tasks differ substantially across domains, illustrating the breadth and heterogeneity of RamanBench.
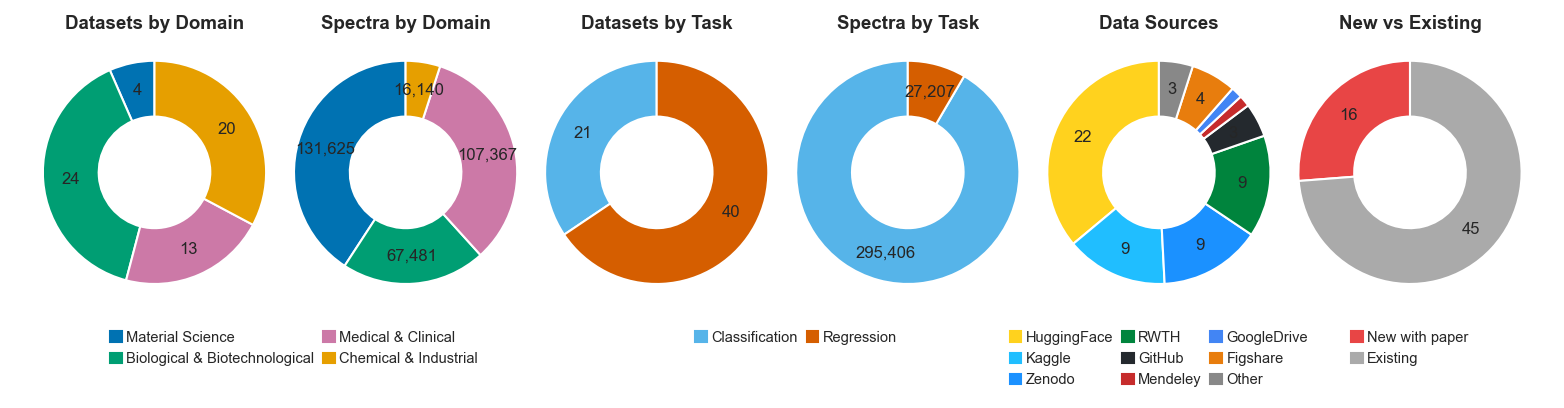
Benchmark composition overview. Domain distribution (left two donuts): Chemical & Industrial contributes the most datasets (33 of 74), while Material Science dominates by raw spectrum count due to the large RRUFF mineral library and MLROD. Task distribution (centre two donuts): Regression datasets outnumber classification (53 vs. 21), yet classification datasets account for over 91% of all spectra. Data sources (fifth donut): Datasets originate from eight hosting platforms with HuggingFace and Kaggle being the two largest. New vs. existing (sixth donut): 16 of the 74 datasets (★) are released for the first time with this paper.
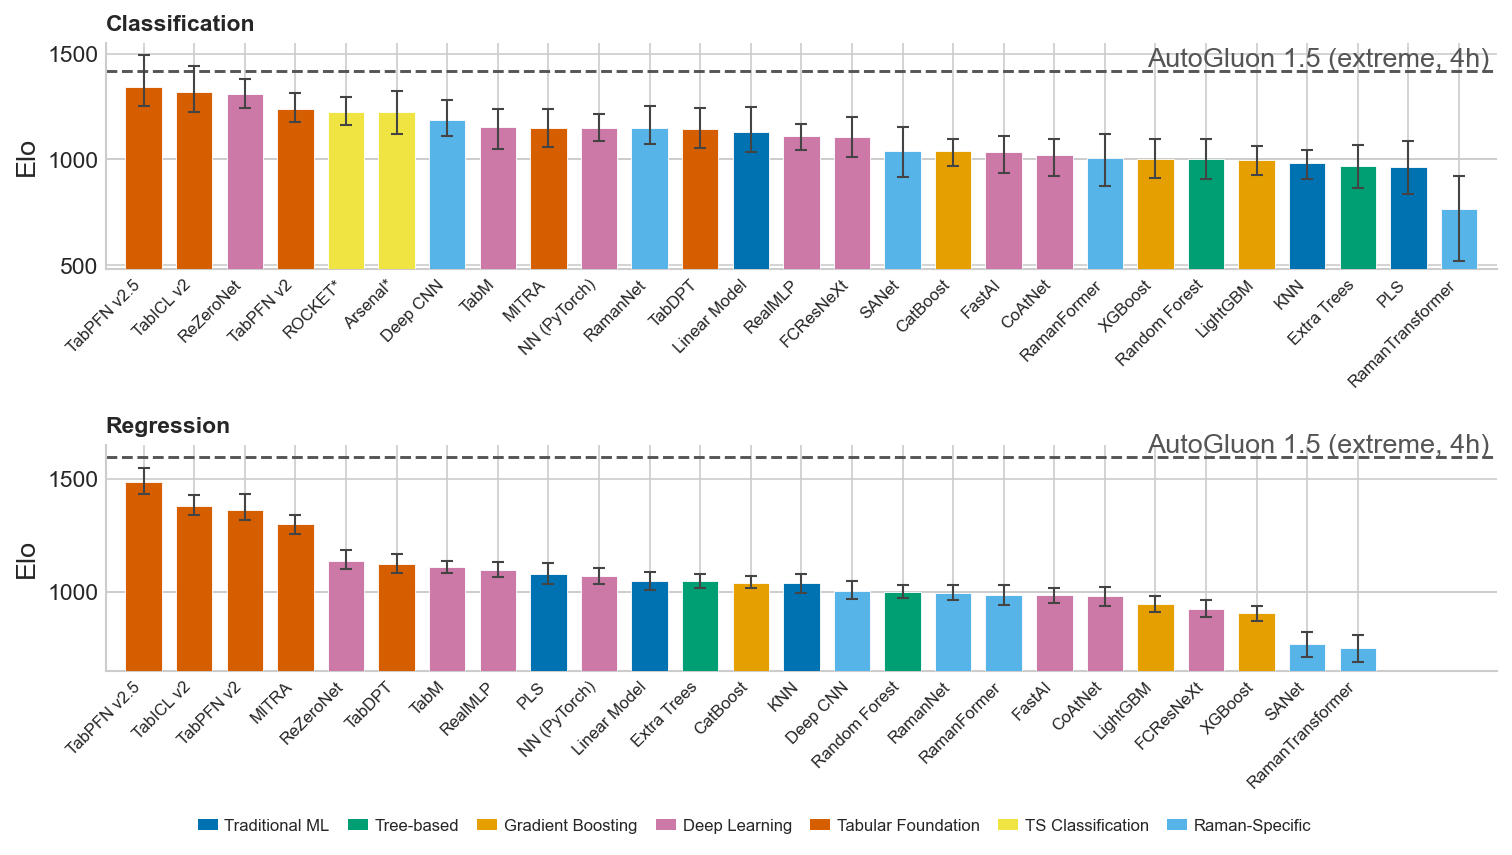
RamanBench Leaderboard, per task. Separate Elo rankings for classification (top) and regression (bottom), so that classification-only models ROCKET and Arsenal (marked with *) are compared only within their realm. Elo ratings are anchored at Random Forest = 1000, with 95% bootstrap confidence intervals (200 resampling rounds over the target pool). Models are colour-coded by algorithmic family; AutoGluon (dashed line) is an upper-baseline reference.
Combined ranking across all tasks. Score is normalized performance averaged across classification (F1) and regression (RMSE) datasets — best model per dataset = 1, median = 0.